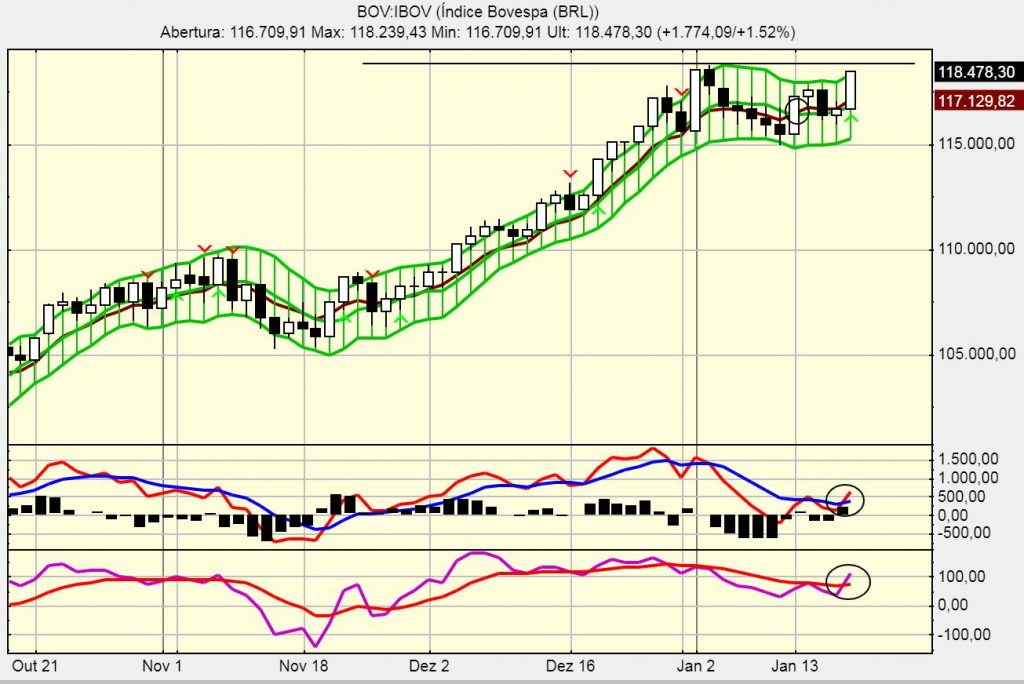
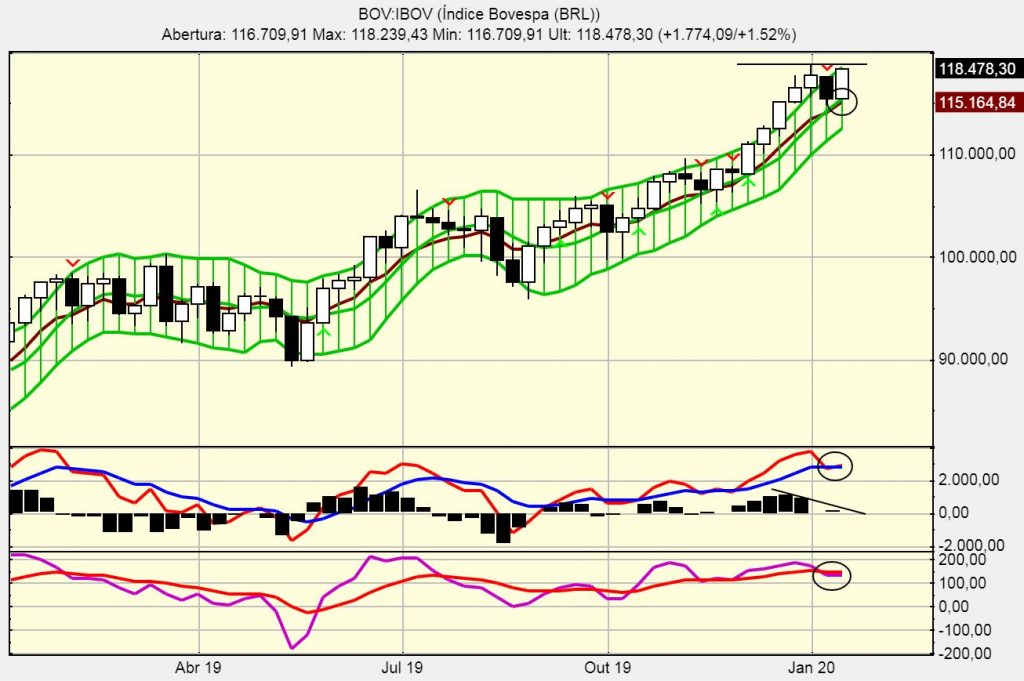
Dear readers, Following is the reading of the IBOV trend on the daily and weekly chart, since the daily chart confirms that the upward trend is maintained with a possible break of resistance at 118.903 points, however on the weekly chart the IBOV shows signs of uncertainty, however the investor must wait the movements of the index this next week which begins on January/2020, for a new reading and confirmation of a break in the ceiling or retraction of the movement with possible corrective movement.